The truth behind GDP
Adjusting GDP for the value of real money (gold) exposes GDP growth to be a meaningless sham. The error is leading towards government debt defaults.
GDP is only the sum total of credit deployed in qualifying activities. It is not to be confused with progress, which is what we all think of when talking of growth or recession. Progress cannot be measured. Furthermore, “growth” is easily manipulated by increasing government spending, which is why governments appear to be successful in managing economic outcomes.
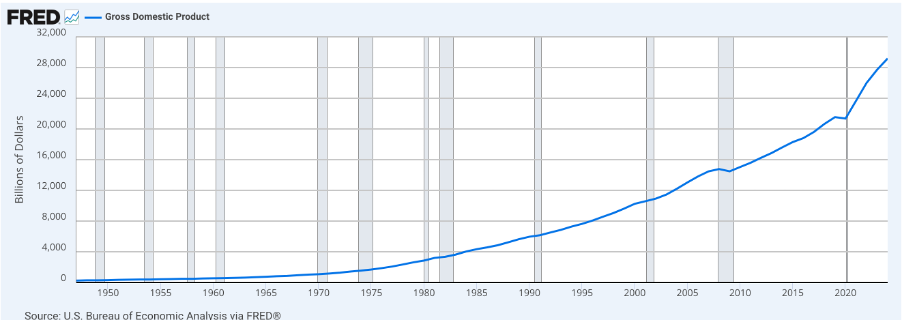
Anyone looking at the FRED chart below should smell a rat. Under our dear leaders’ guidance, GDP continues to grow through thick and thin with hardly an interruption
.But when you bear in mind that this elysian effect includes the bulk of the federal government’s debt creation which has just crossed the $37 trillion barrier, even more than the nominal GDP total, we are left wondering how much of this stimulus has been productive. The answer is not very much, because the definition of economic activity must exclude government intervention: at least that is according to pre-Keynesian classical definitions.
Most of GDP growth is down to currency debasement, a continuing feature of central banking which led to a run on the Fed’s gold reserves in the great depression, and a post-war run under the Bretton Woods system which was finally abandoned in 1971.
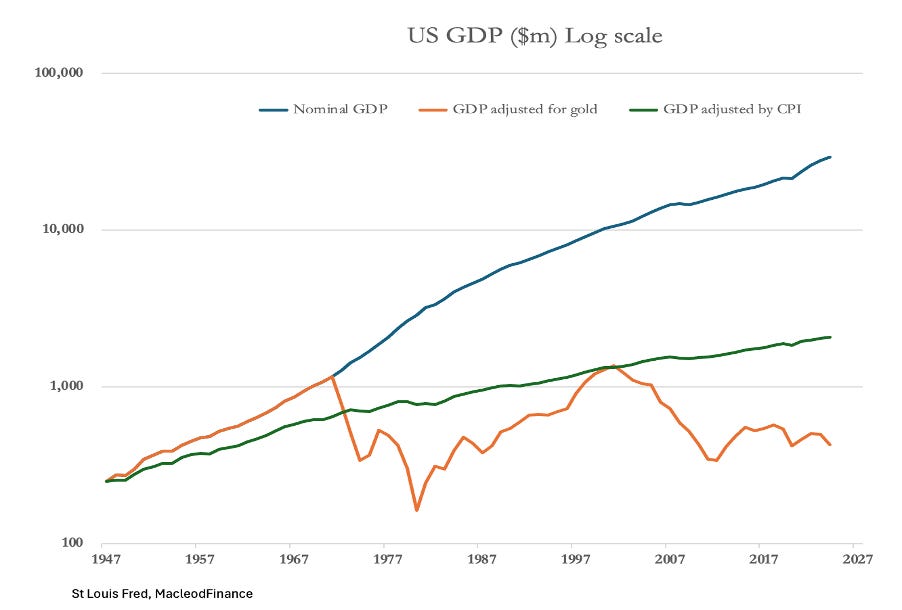
The chart below shows nominal US GDP, GDP adjusted by the consumer price index, and also by the gold exchange rate.
From 1947 to 2024, the increase in nominal GDP was 117 times. Adjusted by the CPI it increased 8.3 times, and by gold only 1.7 times. Gold is relevant because it is real legal money despite US government propaganda denouncing it, proved to have relatively constant purchasing power over time.
We should know that the CPI adjustment underestimates the dollar’s debasement, due to adjustments to price inputs. And we should also note that gold’s value has been routinely suppressed and manipulated by governments in a policy of promoting the dollar as the new monetary standard. For this reason, it appears more volatile.
In the post-war period, the gold/dollar ratio was artificially maintained by the US selling down its gold reserves, which in 1948 were 21,682 tonnes, nearly 72% of all central bank reserves at that time, and about 43% of all above-ground gold stocks. By 1971, when President Nixon finally ended the $35 peg all that remained was 9,070 tonnes, less than 25% of central bank reserves and only 12% of all above-ground stocks. This deterioration in gold reserves was deemed unsustainable.
Before 1971, the maintenance of the gold peg under the Bretton Woods Agreement was what stabilised commodity and consumer prices. Between 1947 and 1971, the Fed’s base money had doubled. Following Bretton Wood’s suspension, the brakes were let off with base money increasing ten-fold by today. Consequently, nominal GDP in dollars is radically different from that expressed in gold.
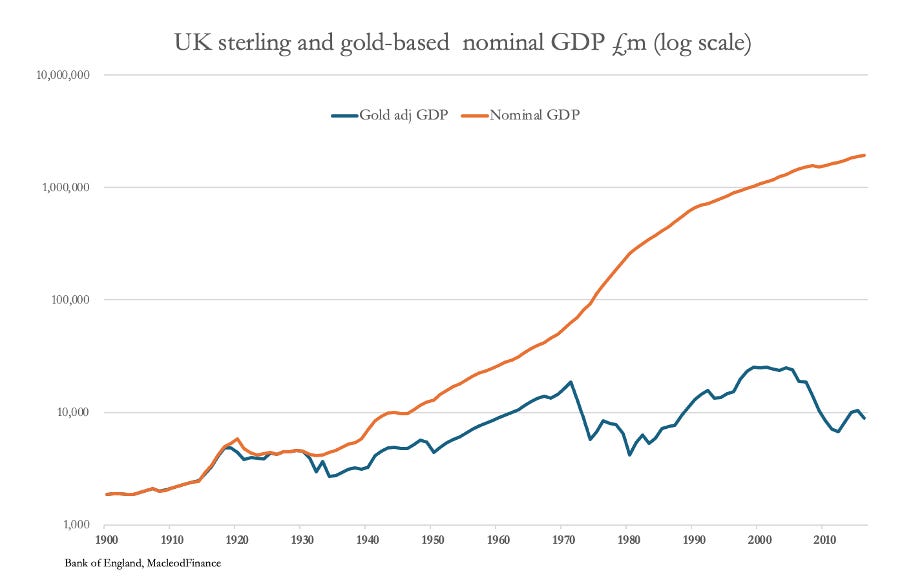
The situation in the UK is similar to that of the US. This time, in the chart below we go back over 100 years.
In this case, nominal GDP has increased 1,034 times between 1900—2016. Measured in gold it has increase only 4.7 times.


