
A tale of two gold markets
The shakeout in gold and silver markets was triggered by Trump’s landslide. All US markets are responding with conventional confusion, ignoring the contradictions and dangers in Trump's polices

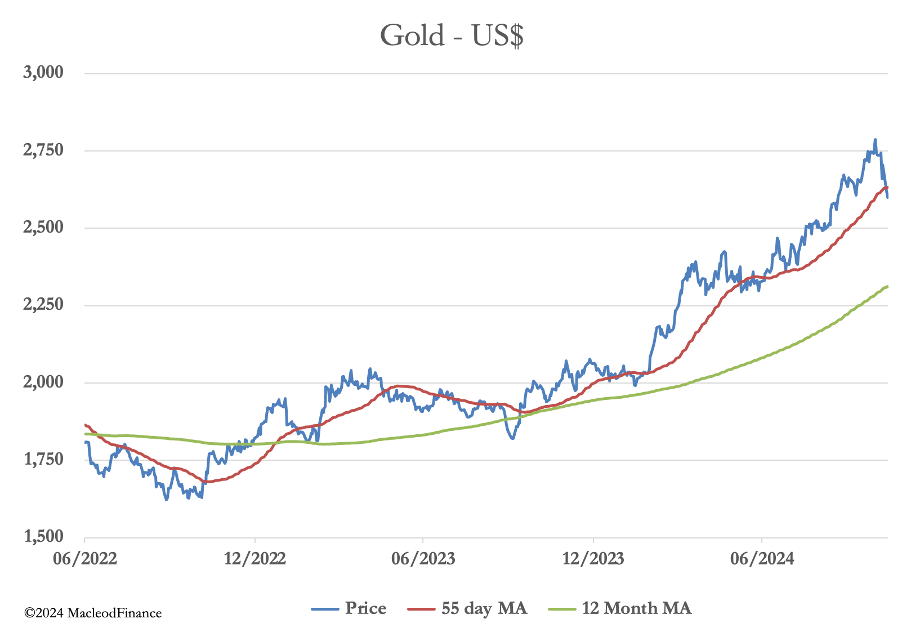
To put gold’s $200 decline in perspective, the technical chart above shows a normal bull market consolidation testing the 55-day moving average which has generally provided support since 2023. Will this support hold? We look at the dynamics behind current events.
